

Downtrend Reversal - Strategy to multiply return
A strategy for experienced player and best for long term investments

📈 Market Insights: Downtrend Reversal Strategy
The Downtrend Reversal Strategy focuses on spotting stocks transitioning from persistent downtrends to new uptrends. It uses reversal patterns and technical indicators to pinpoint shifts in market sentiment, offering opportunities for strategic entry at lower price levels and potential profits during recovery phases.
🎯 Strategy Objective
To capitalize on oversold stocks by identifying recovery opportunities, entering at low prices, and riding the wave of value restoration. The strategy can work for the experienced player well and even better for medium term and best for long term investments.
🔑 Practical Insights
Market Sentiment: Success hinges on recognizing shifts in investor psychology. Discipline is key when entering during fear and uncertainty.
Volume Confirmation: Reversal patterns are more reliable with increasing trading volumes, reflecting genuine buying interest.
Risk Management: Always trade with a plan. Use stop-loss levels or set price targets to protect your capital.
🔄 Understanding the Market Cycle
Markets move through four key stages:
Accumulation (Basing Area): Consolidation and early recovery.
Advancing Stage: Stocks break out into an uptrend.
Distribution Area: Prices peak and stall.
Declining Stage: Downward trends dominate.
📌 Focus: Transition from Declining to Advancing
Identifying the Basing Area (Stage 1) after the Declining Stage (Stage 4) is crucial for spotting stocks poised for an Advancing Stage (Stage 2).
Signs of the Transition:
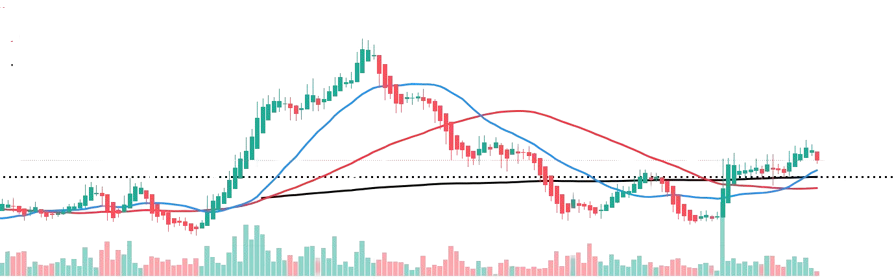
Declining Stage (Stage 4):
Persistent downtrend with lower highs and lows.
Fear-driven selling dominates, but overselling subsides as support levels form.
Early accumulation begins as informed investors step in.
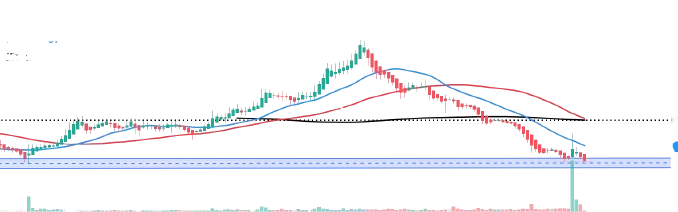
Basing Area (Stage 1):
Prices stabilize and consolidate within a narrow range.
Subtle volume increases hint at growing accumulation.
Advancing Stage (Stage 2):
Breakouts above resistance levels signal the start of an uptrend.
Higher highs and higher lows emerge, with moving averages turning positive.
Rising volumes confirm increased buying interest.
🔍 Key Indicators for Reversal
Reversal Patterns:
Double Bottoms.
Inverted Head & Shoulders.
Bullish Engulfing Candlesticks.
Entry Points:
Enter when prices break resistance levels or downtrend lines, confirmed by strong volumes.
Stop-Loss Placement:
Position below the most recent low or a significant bullish candle.
Exit Strategy:
Exit when momentum weakens or prices hit a pre-defined profit target.
💡 Pro Tip:
During a downtrend, rallies are often short-lived. These moments allow sellers to exit, but they can also signal the start of a value-driven recovery.
Disclaimer:
This content is for informational purposes only and does not constitute financial advice. Always consult with a professional advisor before making investment decisions.