


Can One Number Help You Find the Right Stock?
Identifying a good investment is rarely straightforward. Investors must assess business quality, earnings growth, financial strength, valuation and market trends. They must also decide whether the prevailing share price offers an attractive entry point.
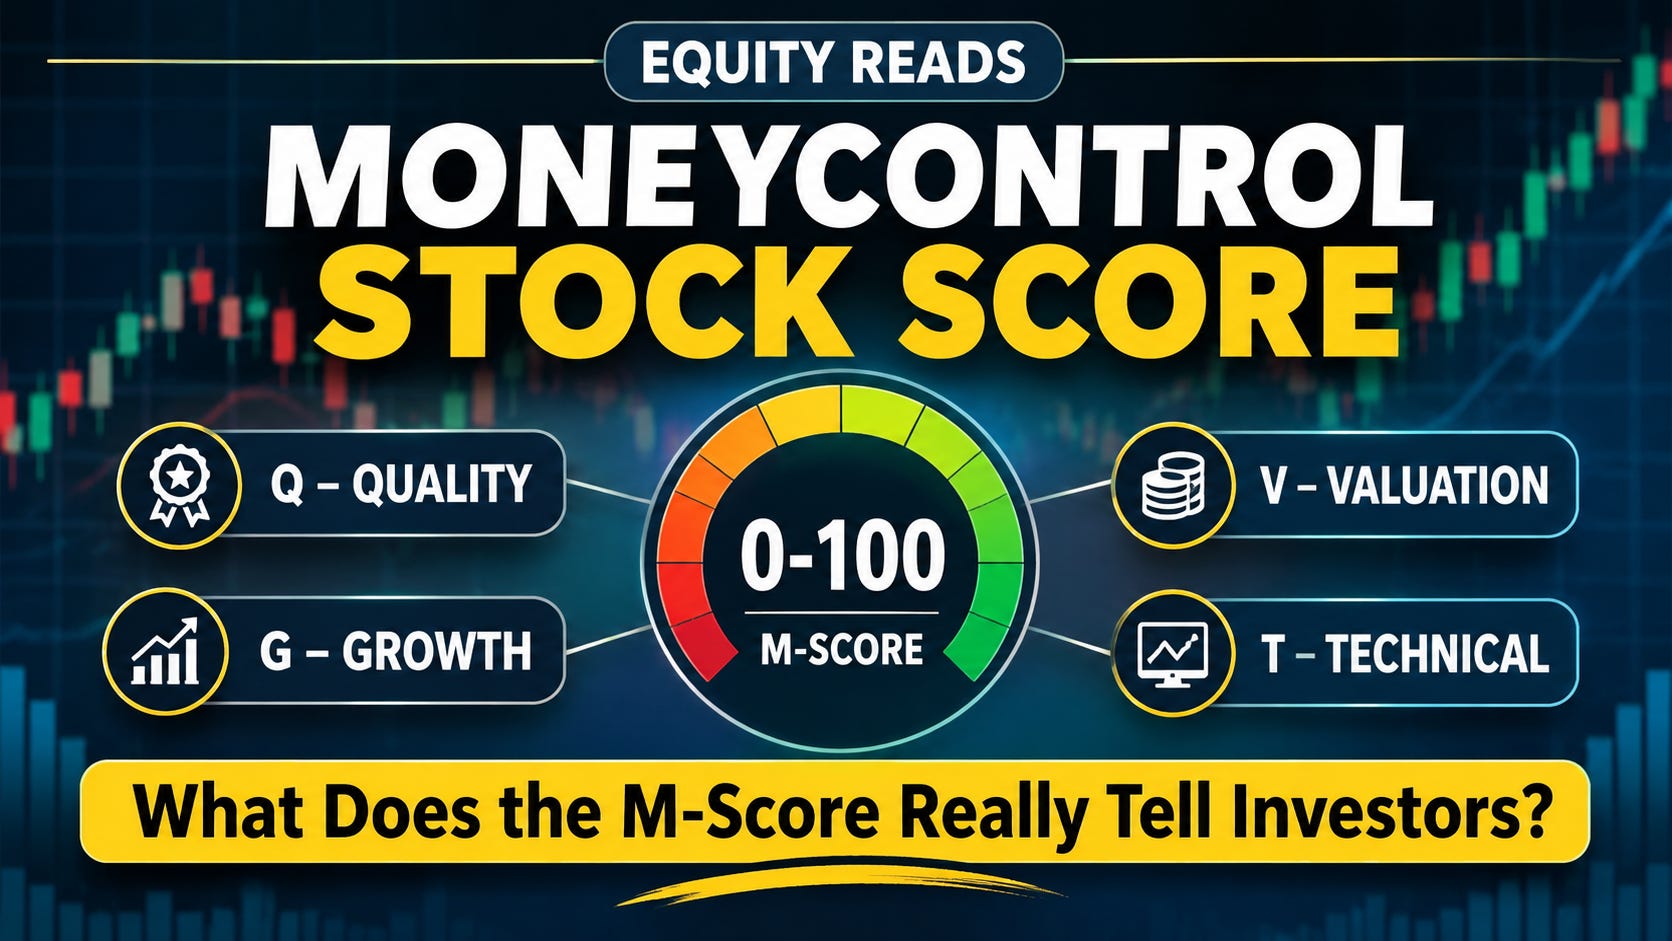
Moneycontrol’s Stock Score, popularly referred to as the M-Score, attempts to simplify this process. It brings together multiple financial, fundamental and technical indicators into a composite rating out of 100.
At first glance, this appears useful. Investors can screen hundreds of companies and identify those receiving stronger overall ratings. However, an important question remains: Does a high M-Score identify a good investment, or merely a company that scores well on a particular set of parameters?
There is an equally interesting possibility. Could a company with a relatively low score, but improving fundamentals and technical indicators, offer a more attractive investment opportunity?
The distinction matters. A good business, an attractively valued stock and a well-timed investment are not necessarily the same thing.
This report examines the M-Score framework, its usefulness and limitations, and how investors can incorporate it into a more comprehensive stock-selection process.
Understanding Moneycontrol’s Stock Score
MC uses a multi-factor algorithm that evaluates more than 35–40 financial, fundamental and technical parameters to arrive at an overall score out of 100.
The methodology is built around four principal factors:
Q – Quality Factor
The Quality Factor examines the financial strength and earnings quality of a company. Some of the parameters considered include:
Stability of net profit margins.
Debt-to-equity ratio relative to industry averages.
Cash flow from operations.
Promoter and institutional shareholding.
A company with consistent profitability, manageable debt and healthy cash generation generally demonstrates better financial resilience.
G – Growth Factor
The Growth Factor evaluates the company’s historical business performance and growth trajectory.
Important parameters include:
Sales growth.
EBITDA growth.
Gross block growth.
Return on Equity (ROE).
Sustained growth in revenue, profitability and returns can indicate an expanding business with the potential to create long-term shareholder value.
V – Valuation Factor
The Valuation Factor assesses whether a company’s shares are attractively priced compared with industry peers.
It considers parameters such as:
Price-to-Earnings (P/E) ratio.
Price-to-Book (P/B) ratio.
Dividend yield.
An otherwise attractive company may not necessarily represent a good investment if its valuation already reflects excessive optimism.
T – Technical Factor
The Technical Factor evaluates the stock’s price behaviour and market strength through chart-based indicators.
This component is particularly relevant for investors who consider price trends, momentum & market participation alongside financial fundamentals.
What Does the Overall Score Indicate?
Moneycontrol classifies stocks with a score of 70 or above as top-scoring stocks.
However, the overall rating should not be considered in isolation. The individual Q, G, V and T scores provide additional information about the strengths and weaknesses behind the final rating.
For example, consider four hypothetical situations:
A company scoring highly across all four factors may demonstrate a relatively balanced investment profile.
A company with strong Quality and Growth scores but weak Valuation and Technical scores may represent a fundamentally sound business facing valuation concerns.
A company with a strong technical score but weaker Quality may be experiencing a market-driven rally despite underlying financial concerns.
A company with attractive Valuation but weak Growth and Technical scores may require further investigation before considering an investment.
These examples illustrate an important distinction: two companies with similar overall scores can have substantially different investment characteristics.
Red Flags: An Additional Warning Mechanism
Moneycontrol also identifies potential financial warning signals through its Red Flags feature.
These indicators are displayed separately from the four principal factors and are not directly included in the Stock Score calculation.
They can help investors identify potential weaknesses in a company’s financial position, including concerns relating to leverage and declining profitability.
An Important Limitation: The Formula Is Not Fully Disclosed
While the M-Score offers a useful framework, one significant limitation deserves attention. It does not publicly disclose the complete mathematical formula, individual parameter weightings or all the scoring thresholds used in calculating the overall rating. Consequently, investors cannot independently reproduce the exact score using publicly available information.
The score should therefore be treated as an analytical screening indicator rather than an independently verifiable financial model.
Furthermore, historical financials and existing technical conditions cannot guarantee future returns. Market sentiment, changing business conditions, corporate developments and broader economic factors can influence stock prices otherwise.
How Should Investors Use the M-Score?
Stock Score can serve as a useful starting point for identifying companies worthy of further research and investigation. However, it should not be treated as the sole basis for making investment decisions or determining when to buy or sell a stock.
A more comprehensive approach would combine the M-Score with an independent assessment of 5 additional parameters:
Financial Quality and Debt
Shareholding Trends
RSI and Momentum
Moving Averages and Weinstein Stages
Support, Resistance and Volume
Combining these parameters with the M-Score can help investors distinguish between fundamentally attractive companies and stocks that also offer favourable investment entry opportunities.
The Bigger Picture: A High Score Is Not Always a Buy Signal
One of the most important lessons for investors is that business quality and investment timing are two different considerations.
A stock scoring 85 may represent a financially strong company with attractive growth prospects. However, if its price is significantly extended, the immediate risk-reward opportunity may not be favourable.
Conversely, a company scoring 55 may be experiencing financial or valuation weaknesses but could also be approaching an important technical reversal. Such a situation warrants investigation, not an automatic buy decision.
This is particularly relevant when screening beaten-down stocks. Companies experiencing prolonged corrections may eventually develop accumulation patterns, improve relative strength and begin forming a new technical base.
The challenge is to identify genuine improvement rather than mistake a temporary bounce for a sustainable reversal. Therefore, investors should evaluate the overall business, financial position, valuation and price behaviour before making an investment decision.
Conclusion
M-Score, therefore, provides a convenient framework for comparing companies across: Quality, Growth, Valuation and Technical strength.
Its greatest advantage is the ability to simplify a large amount of information into an easily understandable rating. However, undisclosed calculation methodology and the limitations of composite scoring mean that it should not replace independent research.
At Equity Reads, the objective is not merely to identify stocks with high ratings but to find companies where business fundamentals, valuation and technical conditions offer a favourable combination.
A high score may identify a promising company, but disciplined research and the right entry price determine whether it becomes a promising investment.
Disclaimer
This report is intended solely for educational and informational purposes and should not be construed as investment advice, an offer or solicitation to invest. The observations and analytical framework presented herein are based on publicly available information. M-Score methodology may change, and its complete calculation formula is not publicly disclosed.
Investors should independently verify all relevant information, conduct their own due diligence and consider their financial objectives and risk tolerance before making investment decisions. Equity Reads accepts no responsibility for any investment losses arising from the use of the information or opinions expressed in this report. The writer has no connection with Moneycontrol or the companies discussed in any form.