

Recently failed Breakouts and a Stock-Specific Analysis
The thread continues

Building on our earlier newsletter, "Technical Analysis and the Failed Breakouts," revisited the concept of failed breakouts. For the sake of repetition again a failed breakout occurs when the price crosses a support or resistance level but then reverses back into its previous range, often resulting in "bull traps" or "bear traps." Below, we analyze specific stock cases and the causes behind such failed breakouts.
Key Causes of Failed Breakouts
Low Volume and Volume Shrinkage
Breakouts that occur with low trading volume or experience a sudden decline in volume lack strong institutional participation, making them more prone to failure.Large Run-Ups and Prices Straying Far from Bases
Significant price surges before breakouts or prices moving too far from their base levels (due to events or technical factors) can signal misleading breakouts.Excessive Price Fluctuations ("Traffic")
Frequent price fluctuations during consolidation or run-ups can generate false breakout signals.Market Sentiment Shifts
Changes in sentiment caused by economic reports, earnings updates, geopolitical events, or market corrections can lead to reversals.Algorithmic and High-Frequency Trading (HFT)
Algorithms and HFT can create a temporary illusion of high-volume during breakouts but may exit quickly, reversing the price movement and affecting retail traders.False Signals Due to Market Manipulation
Big players often monitor the same charts and movements. By orchestrating reversals or retesting support levels, they can influence public participation and inflate situations, leading to failed breakouts.
Case Studies of Failed Breakouts
1. Accelya Solutions India

Failed Breakouts: July 15–16, 2024, and October 3–4, 2024.
Observations: Both instances showed volume shrinkage post-breakout, with prices moving away from their base in the first instance.
2. Adani Green Energy

Failed Breakouts: June 3–4, 2024, and September 26–27, 2024.
Observations: Both breakouts were unsupported by volumes and occurred far from base levels. In contrast, successful breakouts on November 2024 and February 8–9, 2024, were near the 20-day moving average.
3. Antony Waste Handling Cell
Failed Breakouts: October 16–17, 2024, and November 5–6, 2024.
Observations: Both cases showed insufficient volumes.
4. C. E. Info Systems (Map My India)

Failed Breakouts: May 1–2, 2024, and July 12–16, 2024.
Observations: Volume shrinkage was evident after the breakout in both cases.
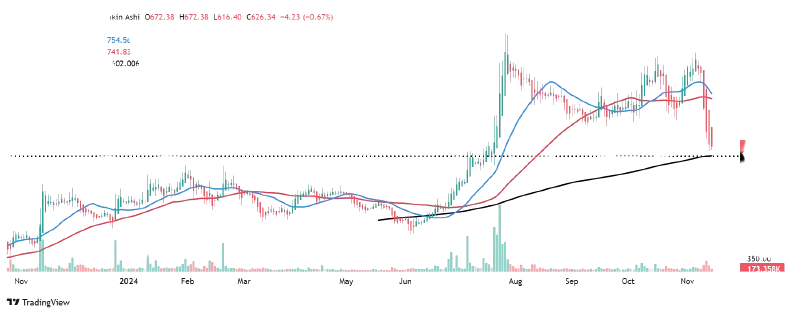
5. Tara Chand Infra Logistic Solutions
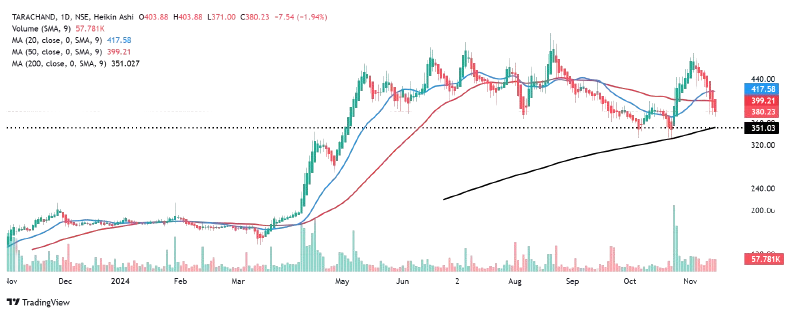
Failed Breakouts: August 21–22, 2024.
Observations: Immediate volume shrinkage and prices straying from their base. The breakout on April 8 provides a better contrast.
6. Tube Investments of India

Failed Breakouts: May 12–13, July 11, and October 28, 2024.
Observations: Moderate volumes and prices far from base levels contributed to failures. Market sentiment shifts in late October added to the reversals.
7. Universal Cables

Failed Breakouts: July 25–26, September 12–16, and November 7, 2024.
Observations: Moderate volumes with subsequent shrinkage.
8. Usha Martin Ltd

Failed Breakouts: April 30 and July 5, 2024.
Observations: Patterns align with typical volume deficiencies.
9. Unichem Laboratories

Observations: A mix of failed and successful breakouts highlights the role of volume. This serves as an excellent case study for traders seeking deeper insights.
Conclusion
By understanding specific failed breakout scenarios and their underlying causes, traders can better position themselves to:
Minimize losses.
Identify contrarian opportunities.
Wait for opportunities at retested positions.
Enter trades with higher success probabilities.
Disclaimer: This document is for informational purposes only and does not constitute investment advice. Opinions expressed are personal and may contain inaccuracies.