

Riding the Wave: A Strategic Guide to Chart Stage Analysis
Master the Four Phases of Market Psychology and Time Your Trades Like a Pro

Chart Stage Analysis, developed by renowned technical analyst Stan Weinstein, is a disciplined framework that categorizes stock price behavior into four distinct stages. By focusing on weekly charts, trend structure, and volume, the method helps investors align with major market moves rather than short-term noise.
The framework provides clear rules for buying, holding, exiting, and avoiding stocks, making it especially effective for long-term investors seeking to capture sustained uptrends while minimizing drawdowns during bear phases.
Conceptual Foundation: Why Stage Analysis Matters
Markets move in cycles driven by investor psychology—accumulation, optimism, euphoria, and fear. Chart Stage Analysis simplifies this complexity into a repeatable, visual model that answers a critical question:
Where is the stock in its lifecycle?
Unlike short-term trading strategies, this approach emphasizes:
Trend alignment over prediction
Weekly timeframes to reduce noise
Capital preservation alongside growth
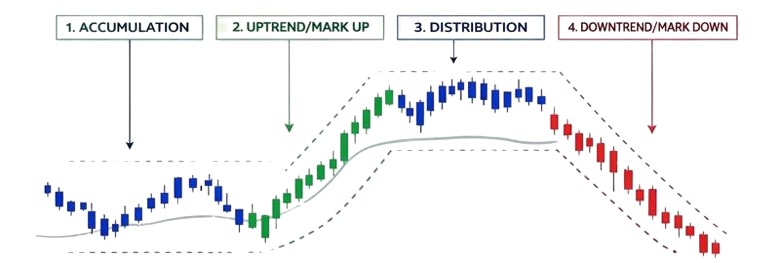
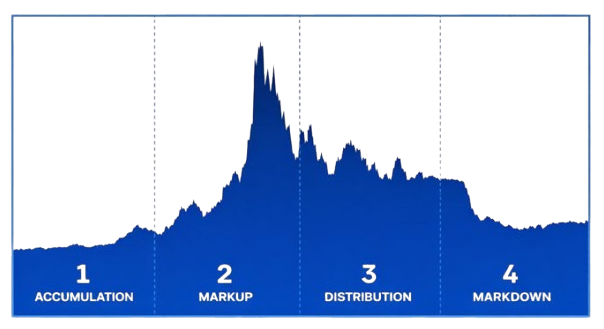
The Four Stages of Chart Analysis
Stage 1: Base Formation (Accumulation Phase)
Key Characteristics
Sideways price movement within a range
Flat 30-week moving average
Low to average volume
Market Psychology
Selling pressure has largely exhausted, but buying conviction is still absent. Institutional accumulation may occur quietly.
Investor Action
Wait and watch. Avoid trading within the base. Prepare for a confirmed breakout.
Stage 2: Uptrend Breakout (Advancing Phase)
Key Characteristics
Breakout above resistance with volume expansion
Rising 30-week moving average
Higher highs and higher lows and Improving relative strength vs market
Market Psychology
Optimism builds as institutions and momentum investors participate. Fundamentals often improve alongside price action.
Investor Action
Buy and hold. This is the most profitable stage. Accumulate on breakouts or shallow pullbacks. Use the 30-week MA as a trailing risk guide.
Stage 3: Topping Phase (Distribution Phase)
Key Characteristics
Loss of momentum and Price oscillates around the 30-week MA
Volume spikes on down days
Failed breakouts and momentum divergences
Market Psychology
Euphoria among late entrants, while smart money distributes holdings into strength.
Investor Action
Exit and book profits. Reduce exposure systematically and protect gains.
Stage 4: Downtrend (Declining Phase)
Key Characteristics
Price below a falling 30-week MA and Lower highs and lower lows
Rallies fail at resistance and Weak relative strength
Market Psychology
Fear and capitulation dominate. Hope-driven buying leads to repeated losses.
Investor Action
Avoid completely. Long-term investors should stay out. Short-selling is only for experienced traders with strict risk control.
Why Chart Stage Analysis Works
Trend alignment: Trades with dominant market structure
Psychological discipline: Clear, rule-based decisions
Risk management: Avoids Stage 4 wealth destruction
Long-term compounding: Captures the bulk of major uptrends
Key Limitations to Acknowledge
Lagging signals: Weekly charts delay entry and exit
Whipsaws: False breakouts in volatile markets
Missed early moves: Conservative confirmation filters
Purely technical: Should ideally be combined with fundamentals
Practical Application Framework
Identify the stage using weekly charts and the 30-week MA
Confirm with volume to validate transitions
Apply stage-specific action (buy, hold, exit, or avoid)
Reassess periodically as trends evolve
Conclusion
Chart Stage Analysis remains a timeless, robust framework for navigating financial markets. While it does not eliminate risk or guarantee perfect timing, it offers something more valuable—structure, discipline, and consistency.
By focusing capital on Stage 2 opportunities and avoiding Stage 4 damage, investors can significantly improve long-term outcomes while maintaining emotional control.
Markets will always cycle. Investors who understand the stages can choose to react emotionally—or act strategically.
References
Weinstein, Stan. Secrets for Profiting in Bull and Bear Markets. McGraw-Hill, 1988
Murphy, John J. Technical Analysis of the Financial Markets. NYIF, 1999
Covel, Michael. Trend Following. FT Press, 2004
Disclaimer: This research report is for educational purposes only and does not constitute investment advice. Investors should conduct their own due diligence and consult with financial professionals before making investment decisions.