

Sky Gold - Golden Future with Strong Financial Performance
Strategic Expansion, Robust Revenue Growth, and Market Dominance


Comprehensive Analysis and Investment Outlook
Sky Gold is a leading manufacturer and distributor in the gold jewelry sector, known for its commitment to quality craftsmanship and innovative designs. With a strong market presence, the company has been expanding both domestically and internationally, tapping into emerging trends and evolving consumer preferences.
Financial Performance: FY 2023-2024
Revenue and Profitability:
Total Revenue: ₹1,745.48 crore (TTM ₹3003 crore), a 51% YoY growth from ₹1,153.80 crore.
Profit After Tax (PAT): ₹40.48 crore (TTM ₹108 crore), a 122% increase from ₹18.61 crore in the previous year.
EBITDA Margin: Improved to 4.43% (TTM 5%), up from 3.15%.
PAT Margin: Increased to 2.31% from 1.61%.
Earnings Per Share (EPS): ₹3.06, up from ₹1.73 (TTM ₹7.81)
Balance Sheet Highlights:
Total Debt: Increased to ₹298.75 crore from ₹145.93 crore.
Tangible Net Worth: Grew to ₹233.90 crore from ₹97.59 crore.
Overall Gearing Ratio: Improved to 1.28x from 1.50x, indicating better financial stability.
Quarterly Performance: FY 2024-2025
Q1
Revenue: ₹723.03 crore
Net Profit: ₹21.23 crore
Q2
Revenue: ₹717.39 crore
Net Profit: ₹35.89 crore
These figures indicate a slight decrease in revenue from Q1 to Q2, while net profit saw a significant increase during the same period.
Recent Developments
Capital Raising: Successfully raised ₹270 crore for expansion and product diversification.
Market Expansion: Actively exploring new markets to boost domestic and international sales.
Sustainability Initiatives: Implemented eco-friendly manufacturing processes and introduced lab-grown diamond collections.
Challenges and Risks
Market Volatility: Fluctuating gold prices impacting margins.
Supply Chain Disruptions: Global supply issues causing delays in raw material procurement.
Export Demand Decline: Slowdowns in key markets i.e. USA and Europe.
SWOT Analysis
Strengths:
Strong revenue growth and profitability.
Established brand reputation with a broad customer base.
Expanding retail and export networks.
Weaknesses:
High dependence on gold prices.
Limited global presence compared to competitors.
Opportunities:
Expansion into emerging markets.
Diversification into other precious metals and jewelry segments.
Threats:
Intense competition in the jewelry industry.
Economic downturns affecting luxury spending.
Future Outlook
Sky Gold is well-positioned for continued growth with its expansion plans and strong financial fundamentals. The company aims to diversify its portfolio with premium and customized jewelry, while leveraging digital transformation to enhance its market reach.
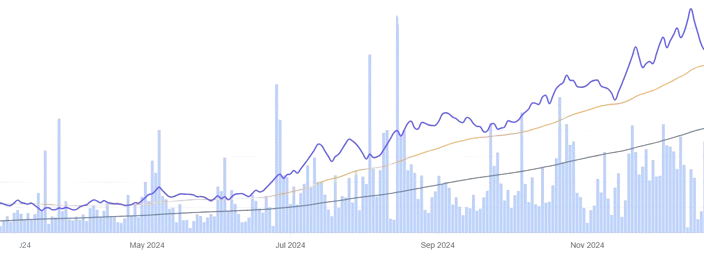
Movement on Chart & Historical Performance
Technical Outlook and Valuation Justification
Momentum Indicators: Bullish sentiment persists, with the Relative Strength Index in the 55-60 range, indicating balanced market positioning.
Price-to-Earnings (P/E) Ratio: Above industry benchmarks, reflecting a premium valuation.
Return Metrics: Return on Capital Employed (ROCE) stands at 18.60%, while Return on Equity (ROE) is at 23.20%.
Financial Performance: Sales, operating profits, operating profit margin (OPM%), net profits, and earnings per share (EPS) are increasing both quarter-over-quarter (QoQ) and year-over-year (YoY).
Conclusion
Sky Gold continues to shine in the jewelry sector with record revenue growth, strong profitability, and strategic market expansion. While challenges such as gold price fluctuations and supply chain disruptions persist, the company’s aggressive expansion, sustainable practices, and innovative product offerings position it well for long-term success.
Final Thoughts
For investors looking for a balanced risk-reward proposition, Sky Gold presents a compelling opportunity. With its strong fundamentals, market leadership, and growth potential, the stock is a valuable addition to a diversified portfolio. Investors should monitor macroeconomic trends but can remain optimistic about Sky Gold’s golden future.
Disclaimer: This analysis is for educational and informational purposes only and does not constitute any financial advice. In its latest circular, SEBI has clarified that individuals providing stock market education must use stock price data with a three-month lag. Accordingly, all data and charts presented here comply with these guidelines. Investors should conduct their own due diligence before making any investment decisions. As the author holds a position in the company, the opinions expressed are personal, potentially biased, and may contain inaccuracies. Additionally, all figures are subject to verification.